Production Ready GIS
Data-Driven
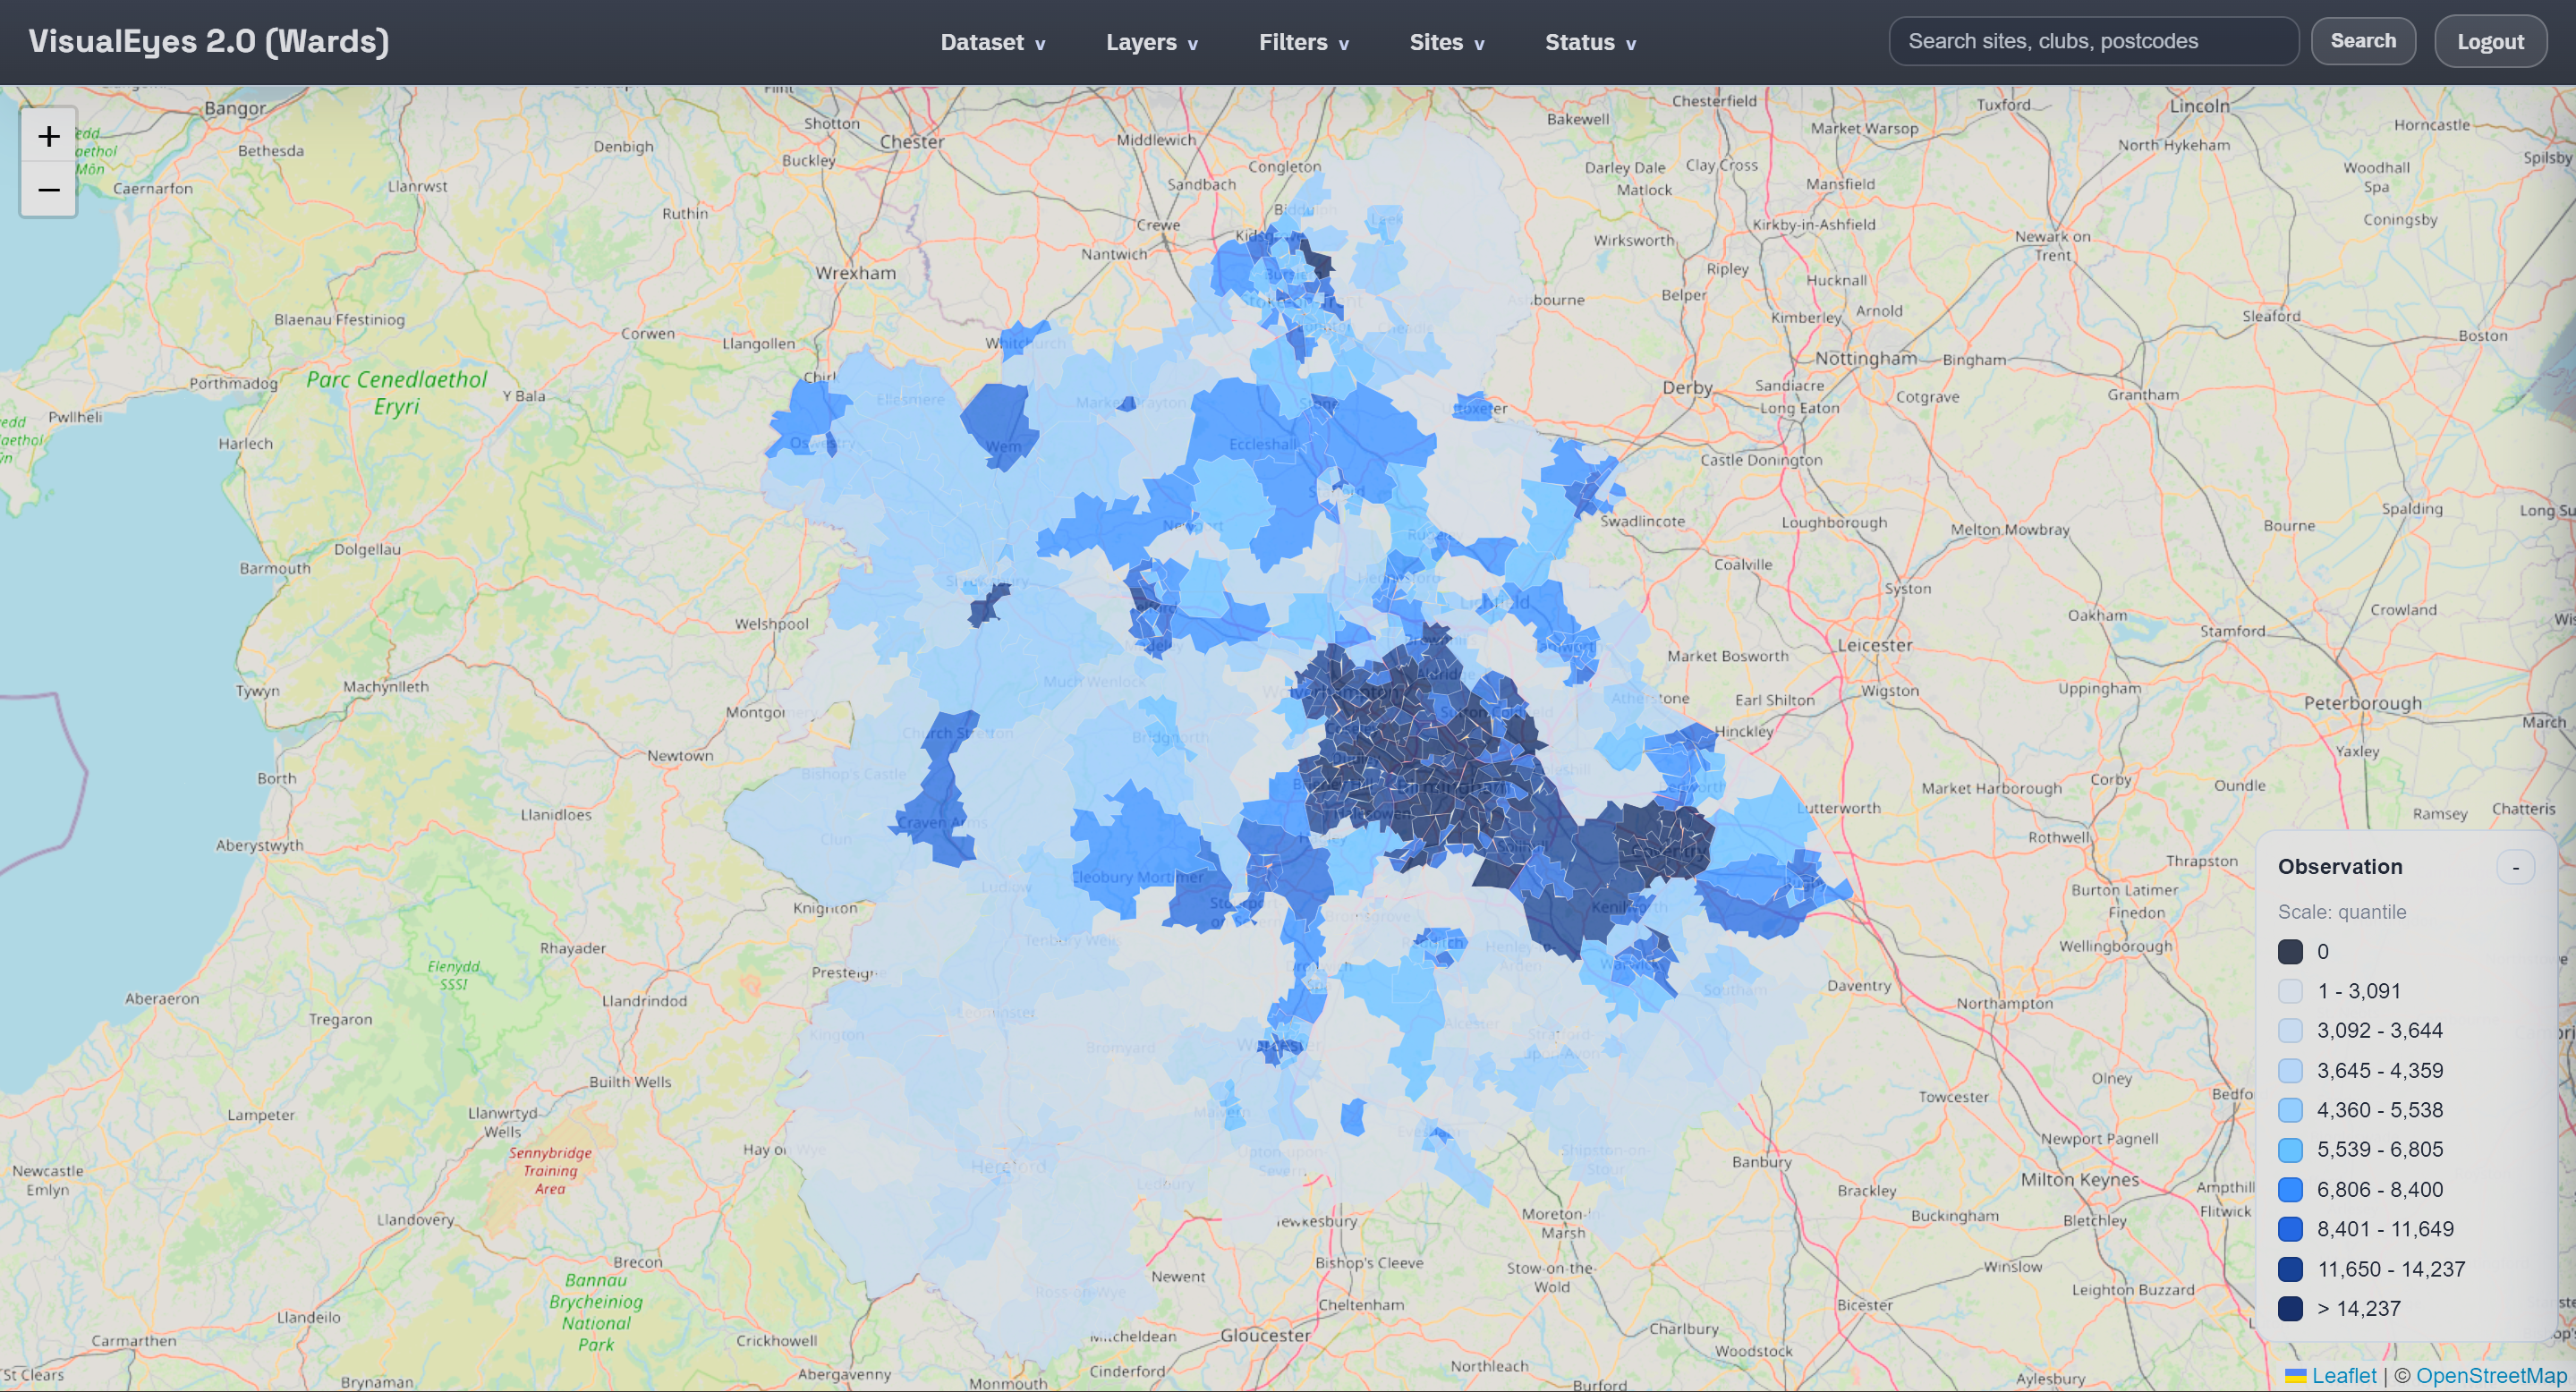
Football Intelligence
A full-stack GIS solution integrating 10+ distinct datasets—from population demographics to flood risk—to transform how sports organizations allocate funding and identify strategic opportunities.
Flask
Backend Core
Leaflet
Vector Engine
PostGIS
Spatial DB
Site Feasibility
87% Match
Flood Risk
Zone 3 (High)